By
Sanjana Chavali
September 25, 2026
•
6
min read
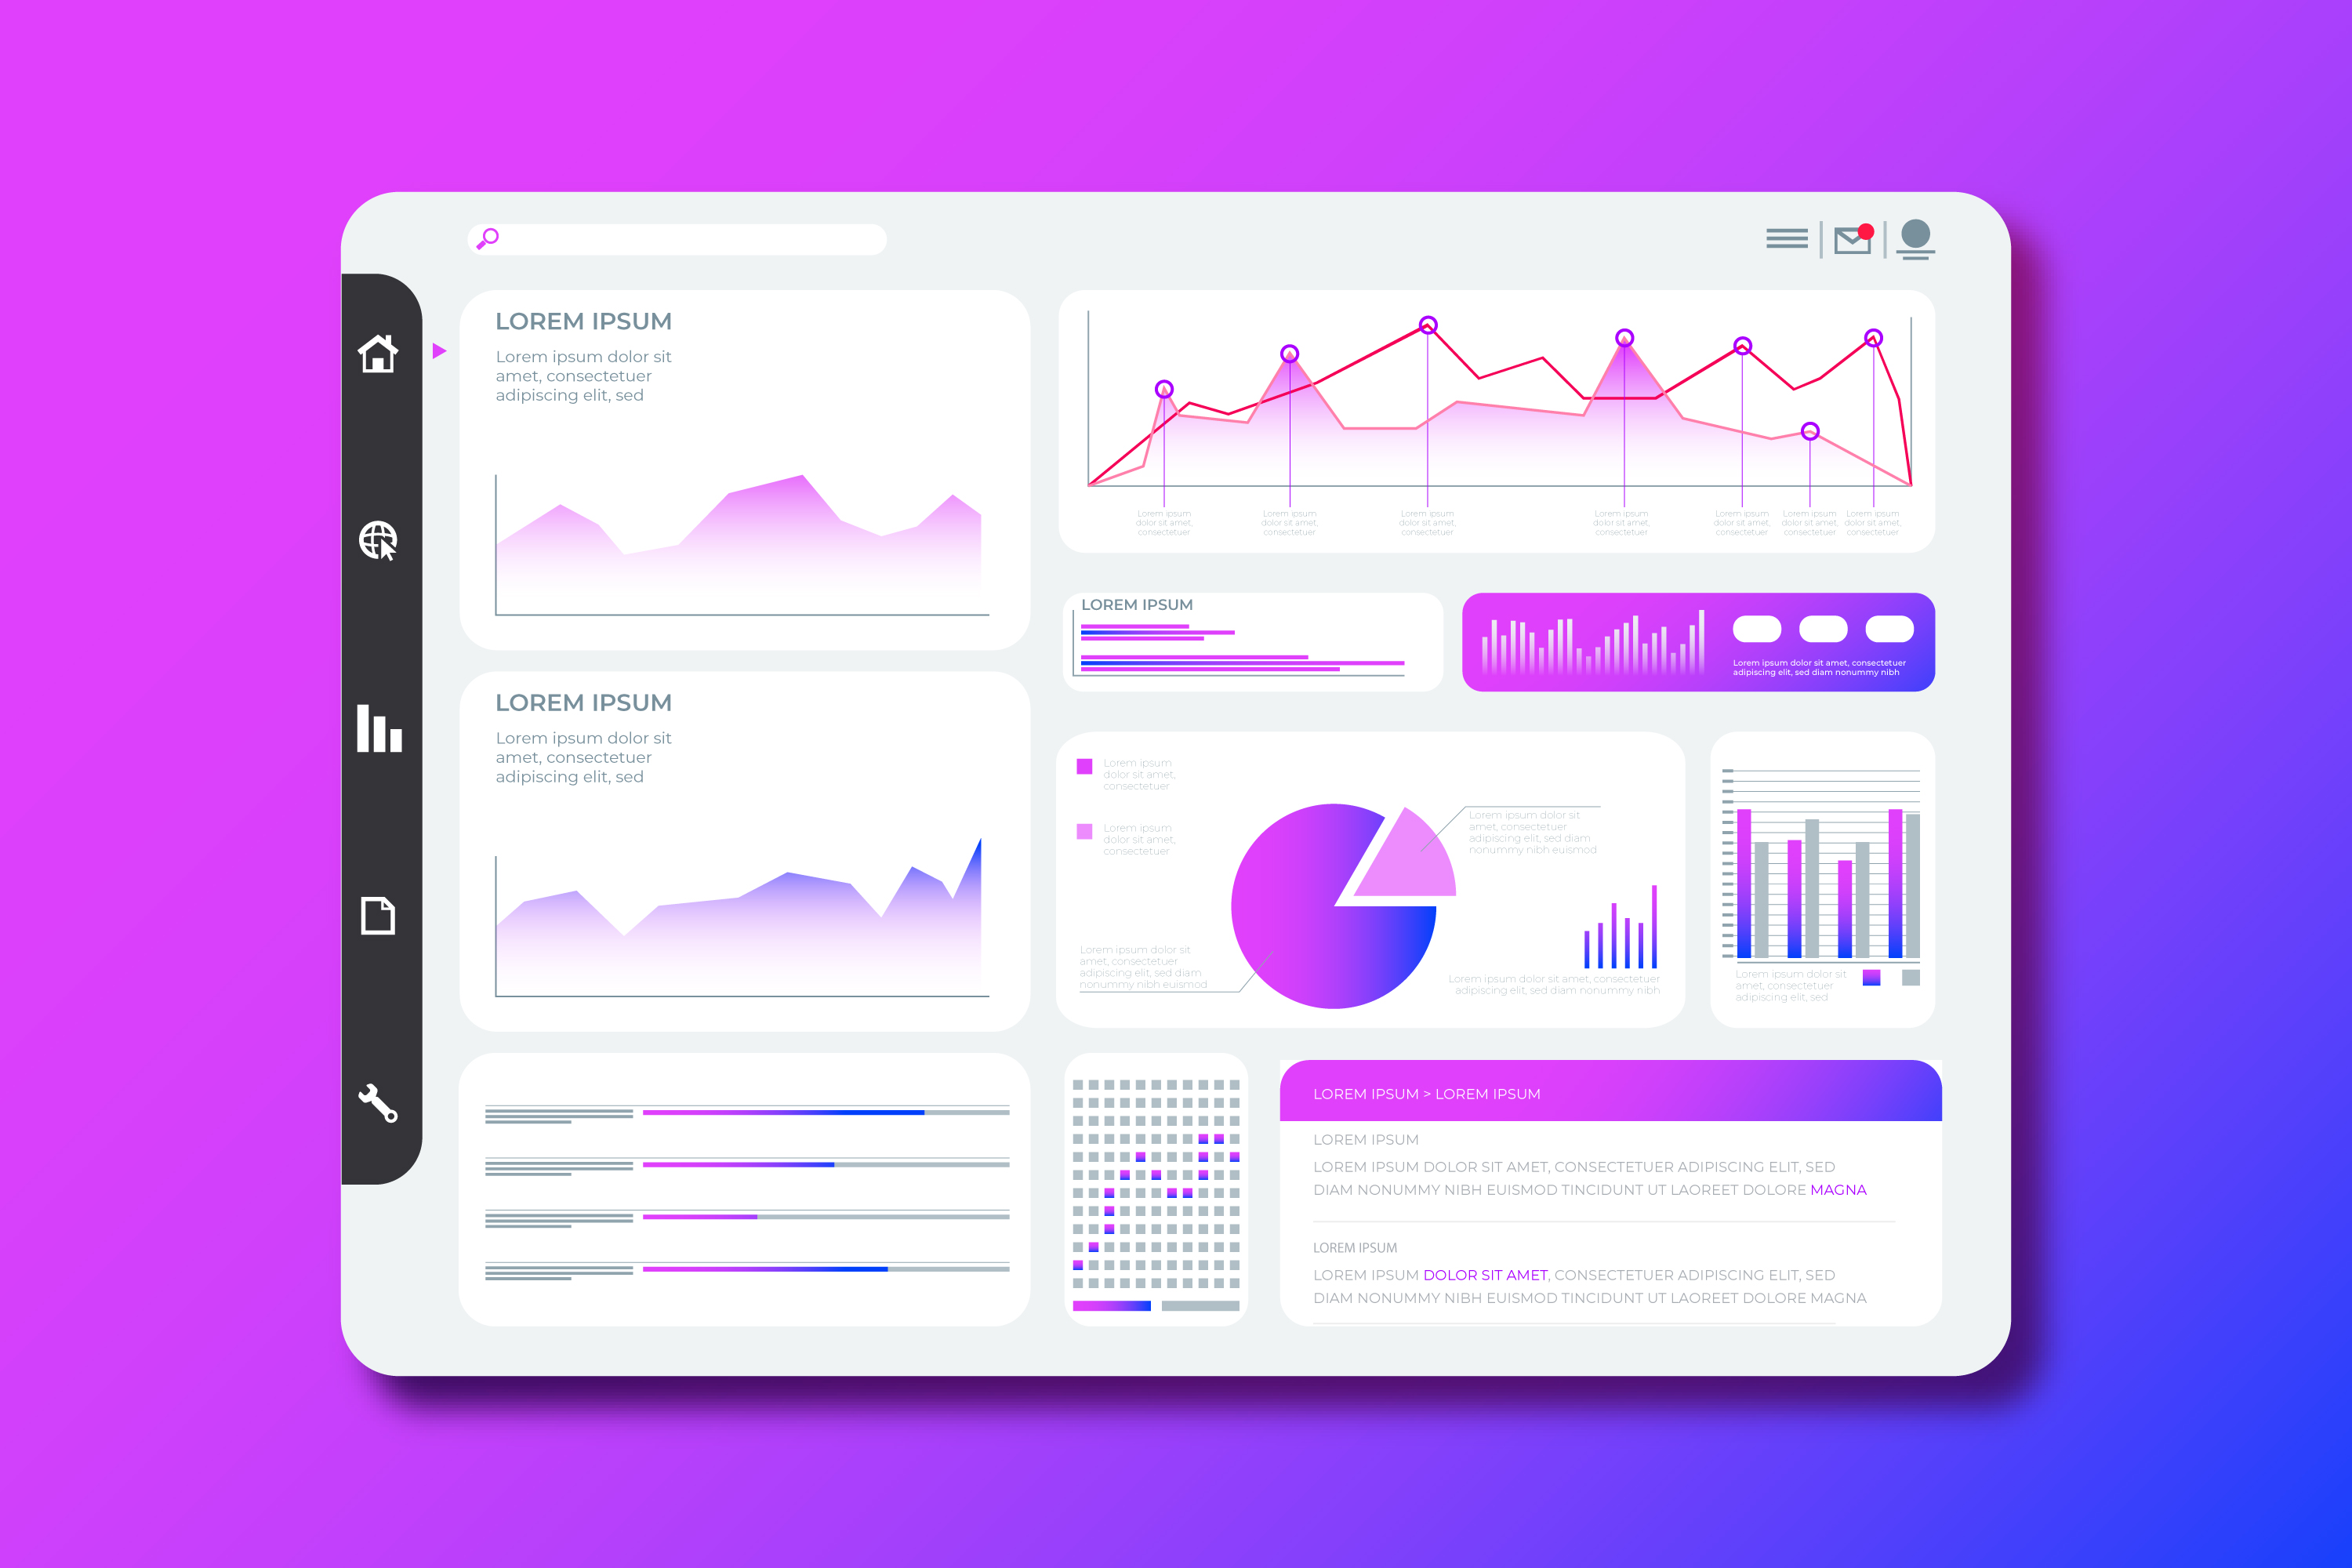
A sales target sounds like a simple thing - a number, set at the start of a period, hit or missed by the end of it. Straightforward enough, right?
But the thing is, that single number means something very different depending on who's looking at it. A frontliner, a store manager, and a regional admin can all be looking at the exact same target on their sales dashboard, when each one is fundamentally asking a different question.
For a salesperson on the floor, a target isn't a strategic figure. It's personal, this number they're measuring themselves against shift by shift, customer by customer, and what they actually need isn't another monthly report but a constant, current answer to a much smaller question: am I on track today?
They need clarity on:
For a frontliner, the target becomes something they can act on during the month, not something they discover after it ends.
A store or cluster manager isn't responsible for one number, they're responsible for a team, and their job is to understand what's happening across that team while there's still time to influence the outcome.
That makes the target a coaching tool. A manager needs to see performance across the people and stores they oversee, identify who's ahead or behind pace, and understand what might be driving those differences, whether that's one associate consistently outperforming the rest, or certain hours producing more transactions than others.
Flexibility matters here too. Different teams don't always define success the same way, and a manager may need KPIs and formulas that reflect how their particular store sells, rather than being restricted to one fixed measure.
For a manager, the target is less something to monitor and more a way of finding where attention or coaching could actually make a difference.
At the regional or administrative level, individual targets become part of a much larger picture. An admin isn't necessarily interested in why one salesperson missed their number yesterday, they're looking across dozens or hundreds of people and stores to understand the patterns underneath the numbers, which products are driving revenue in which regions, how performance breaks down by category, and which stores are consistently pulling ahead of the rest.
Custom KPIs matter here for a different reason than they do for a manager, they let the business define performance around what actually matters to it. A QSR chain might care about transaction speed and volume. A jewellery retailer might care more about category-level revenue or product mix.
The target becomes one input into a much bigger operational picture, more a signal than a single verdict.
Ranking works differently depending on how close the comparison actually feels.
A regional leaderboard is as easy to build as it is to ignore. To a frontliner on their feet the whole day, seeing that they're 147th out of 600 doesn't tell them much, and it definitely doesn't move them. Seeing they're 2nd out of 12 at their own store, or 4th out of 30 across their city, lands differently, because those are people they recognise, the colleagues they work alongside every day. Being first in their own store ends up meaning more than overtaking someone three cities away.
For a manager, the same logic applies one level up. Knowing that their store ranks somewhere in the middle of the region doesn't do much on its own. Knowing exactly which two associates on their own team are behind pace, and by how much, is what actually lets them do something about it.
For an admin or regional lead, proximity looks different again, less about individuals and more about which stores or clusters sit closest to each other in performance, so a dip can be traced to a specific pocket rather than lost in a region-wide average.
At every level, the comparisons that actually change behaviour are the ones close enough to feel specific. Scale is useful for spotting patterns. Proximity is what makes a number feel like it belongs to someone.
Take a store with a ₹50L monthly target split across 12 sales associates.
On paper, that's roughly ₹4.2L per person, but averages rarely tell the whole story.
Footfall isn't evenly distributed across the month, weekends and paydays behave very differently from a random Wednesday lull, and experience levels vary too. One associate might have joined three weeks ago while another has spent two years on the floor.
So the more useful question isn't whether the store will hit ₹50L. It's what ₹50L looks like from each person's point of view.
The associate might see that they've done ₹1.6L, have ₹2.6L left, have 13 days remaining, and are currently ahead of or behind the pace of other associates in their store. The store manager sees the same target distributed across the team, and notices that three associates are tracking well while two are behind pace, with enough of the month left to actually coach or intervene. The regional admin places that store's ₹50L alongside forty others, and can tell whether this is one store underperforming or a category declining across several locations at once.
The number hasn't changed. What each person can do with it has.
Most stores aren't actually missing data, they're missing it at the right time. The associate finds out they were behind pace from a circular after the month ends, when there's nothing left to do about it. The manager pieces together where the team stands from a WhatsApp message sent at 6pm, or a spreadsheet that's accurate as of whenever it was last updated. The admin waits on a monthly report covering a period that's already weeks in the past by the time it lands.
None of this is really a data problem, so much as a timing one. The information exists, but it reaches different people at different points, in different formats, and by the time someone sees it, the chance to act on it may already be gone.
That's what we built Frontlyne's Sales Pulse to address. Think of it as a sales KPI dashboard that gives each role a shared, live view of targets and performance, with the level of visibility and control they actually need. Frontliners can see where they stand and what to do next. Managers can see who's ahead, who's falling behind, and where they can step in. Admins can see the bigger picture across stores, regions, products, and KPIs, and use that to make better decisions, without everyone needing to look at the exact same screen to get there.
Want to see what this could look like for your team?


A sales target sounds like a simple thing - a number, set at the start of a period, hit or missed by the end of it. Straightforward enough, right?
But the thing is, that single number means something very different depending on who's looking at it. A frontliner, a store manager, and a regional admin can all be looking at the exact same target on their sales dashboard, when each one is fundamentally asking a different question.
For a salesperson on the floor, a target isn't a strategic figure. It's personal, this number they're measuring themselves against shift by shift, customer by customer, and what they actually need isn't another monthly report but a constant, current answer to a much smaller question: am I on track today?
They need clarity on:
For a frontliner, the target becomes something they can act on during the month, not something they discover after it ends.
A store or cluster manager isn't responsible for one number, they're responsible for a team, and their job is to understand what's happening across that team while there's still time to influence the outcome.
That makes the target a coaching tool. A manager needs to see performance across the people and stores they oversee, identify who's ahead or behind pace, and understand what might be driving those differences, whether that's one associate consistently outperforming the rest, or certain hours producing more transactions than others.
Flexibility matters here too. Different teams don't always define success the same way, and a manager may need KPIs and formulas that reflect how their particular store sells, rather than being restricted to one fixed measure.
For a manager, the target is less something to monitor and more a way of finding where attention or coaching could actually make a difference.
At the regional or administrative level, individual targets become part of a much larger picture. An admin isn't necessarily interested in why one salesperson missed their number yesterday, they're looking across dozens or hundreds of people and stores to understand the patterns underneath the numbers, which products are driving revenue in which regions, how performance breaks down by category, and which stores are consistently pulling ahead of the rest.
Custom KPIs matter here for a different reason than they do for a manager, they let the business define performance around what actually matters to it. A QSR chain might care about transaction speed and volume. A jewellery retailer might care more about category-level revenue or product mix.
The target becomes one input into a much bigger operational picture, more a signal than a single verdict.
Ranking works differently depending on how close the comparison actually feels.
A regional leaderboard is as easy to build as it is to ignore. To a frontliner on their feet the whole day, seeing that they're 147th out of 600 doesn't tell them much, and it definitely doesn't move them. Seeing they're 2nd out of 12 at their own store, or 4th out of 30 across their city, lands differently, because those are people they recognise, the colleagues they work alongside every day. Being first in their own store ends up meaning more than overtaking someone three cities away.
For a manager, the same logic applies one level up. Knowing that their store ranks somewhere in the middle of the region doesn't do much on its own. Knowing exactly which two associates on their own team are behind pace, and by how much, is what actually lets them do something about it.
For an admin or regional lead, proximity looks different again, less about individuals and more about which stores or clusters sit closest to each other in performance, so a dip can be traced to a specific pocket rather than lost in a region-wide average.
At every level, the comparisons that actually change behaviour are the ones close enough to feel specific. Scale is useful for spotting patterns. Proximity is what makes a number feel like it belongs to someone.
Take a store with a ₹50L monthly target split across 12 sales associates.
On paper, that's roughly ₹4.2L per person, but averages rarely tell the whole story.
Footfall isn't evenly distributed across the month, weekends and paydays behave very differently from a random Wednesday lull, and experience levels vary too. One associate might have joined three weeks ago while another has spent two years on the floor.
So the more useful question isn't whether the store will hit ₹50L. It's what ₹50L looks like from each person's point of view.
The associate might see that they've done ₹1.6L, have ₹2.6L left, have 13 days remaining, and are currently ahead of or behind the pace of other associates in their store. The store manager sees the same target distributed across the team, and notices that three associates are tracking well while two are behind pace, with enough of the month left to actually coach or intervene. The regional admin places that store's ₹50L alongside forty others, and can tell whether this is one store underperforming or a category declining across several locations at once.
The number hasn't changed. What each person can do with it has.
Most stores aren't actually missing data, they're missing it at the right time. The associate finds out they were behind pace from a circular after the month ends, when there's nothing left to do about it. The manager pieces together where the team stands from a WhatsApp message sent at 6pm, or a spreadsheet that's accurate as of whenever it was last updated. The admin waits on a monthly report covering a period that's already weeks in the past by the time it lands.
None of this is really a data problem, so much as a timing one. The information exists, but it reaches different people at different points, in different formats, and by the time someone sees it, the chance to act on it may already be gone.
That's what we built Frontlyne's Sales Pulse to address. Think of it as a sales KPI dashboard that gives each role a shared, live view of targets and performance, with the level of visibility and control they actually need. Frontliners can see where they stand and what to do next. Managers can see who's ahead, who's falling behind, and where they can step in. Admins can see the bigger picture across stores, regions, products, and KPIs, and use that to make better decisions, without everyone needing to look at the exact same screen to get there.
Want to see what this could look like for your team?
Join the brands building better frontline workforces. Live in 50 days. No IT complexity. Dedicated support from day one.


.jpg)
.png)
.png)
.png)
.png)